More AI Deception...

BentinPartner Weekly

Dear Reader,
Please find below our latest Weekly Trend Report.
Have a nice start of the week.
Marc Bentin,
Bentinpartner GmbH
Last week turned out to be more volatile and negative than the headlines moves seem to suggest as the market was confronted with a deteriorating inflation outlook, a selloff in large cap tech companies, notably from META amidst building AI credit concerns and the mounting perception that the AI (debt and equity) financing is hitting a glass ceiling.
In particular on Thursday, after the KOSPI (and its dominant two share components) closed at its lowest level since April (the index is down more than -40% since its peak), US markets also had to cope with a higher-than-expected inflation report, followed by some disappointing tech earnings report from META (or for once considered as such, due to a never-ending promise for more AI debt and equity financed AI related spending).
Mounting concerns around the “Neoclouds” serving AI companies, illustrated most visibly by CoreWeave (CRWV), added fuel to the fire as its bond yields surged toward 15%. That effectively shut the company out of affordable financing, aside from Nvidia’s support, which arrived on Thursday in an awkward attempt to defend CRWV by claiming its funding costs were falling even as every market metric shows them rising sharply, barring further Nvidia‑subsidized lending. As CRWV’s stock collapsed, Goldman raised its price target, which did little to stabilize sentiment.
On the more “positive” side, SpaceX announced it had finalized—price still pending, a USD 40 bn off‑balance‑sheet debt structure to finance its AI buildout through a special‑purpose vehicle designed to purchase Nvidia chips. Even so, SpaceX bond yields climbed 22 bps on Friday to 7.61%, and 49 bps over the week.
The technical picture at the US index levels deteriorated, leaving them with a poor fundamental cocktail of high interest rates, significantly higher inflation (and oil prices), still buoyant sentiment and an expensive valuation (CAPE PE of 44.2) only behind that of dot.com bubble in the year 2000.
In terms of sectors last week only the defensive ones delivered a positive performance (health care, biotech, materials and energy while precious metals and mining took it on the chin at the same time as tech stocks.
On the US economic side, data published last week showed CPI rising in September (+0.6% MoM) at the fastest pace in five months, driven by a 9.1% increase in gasoline prices while the ex-food ex energy inflation also climbed +0.3%, “in theory” reinforcing expectations for additional Fed rate hikes (including potentially this week) but in theory only…
Indeed, the bout of risk aversion that ensued the publication of this inflation report which initially hurt bonds but also AI equities, sent credit spreads sharply higher, reversing the poor sentiment on bonds, transforming them into safe haven for the day…
Consumer sentiment continued to deteriorate in October amid persistent inflation, tepid hiring and elevated mortgage rates.
On Friday, US consumer sentiment edged down to a five-month low in October (easing to 48 from 48.1) in September as high prices and rising interest rates depressed morale. At the same time, the buying conditions for durable goods dropped to 50, a fresh record low and consumers now expect prices to rise 4.7% over the next year (up from 4.6% last month).
In bonds, besides a notable turnaround on Thursday (which ended positively for US bonds with 10Y US yields falling back just below 5%), tensions remained on the EU debt front following a week end of social unrest in France (and in several other EU cities) that sent the OAT /Bund spread 15bps wider to 175 bps, or its widest level since 2011, also leaving EU banks -5% on the week (and nearly -10% so far this month).
US High Yield spreads and IG spreads widened in that context by respectively 6 and 5 bps last week, back to the highs dating from liberation Day.
The Dollar Index closed marginally higher last week.
The liquidation that occurred in precious metals also looked like further deleveraging impacted the sector with gold and silver shedding 6% and 5% respectively.
At the same time, oil closed the week near the highs since May on further military escalation in the Gulf.
.
Investors will face another pivotal week with a Fed decision on Wednesday, the GDP report on Thursday the PCE report (expected to rise to 3.6% from 3.4%) and more mega caps earnings reports (MSFT, GOOG on Wednesday a few hours after the FOMC outcome and AMZN on Thursday) while the BoJ also expected to add some uncertainty with a possible rate rise.
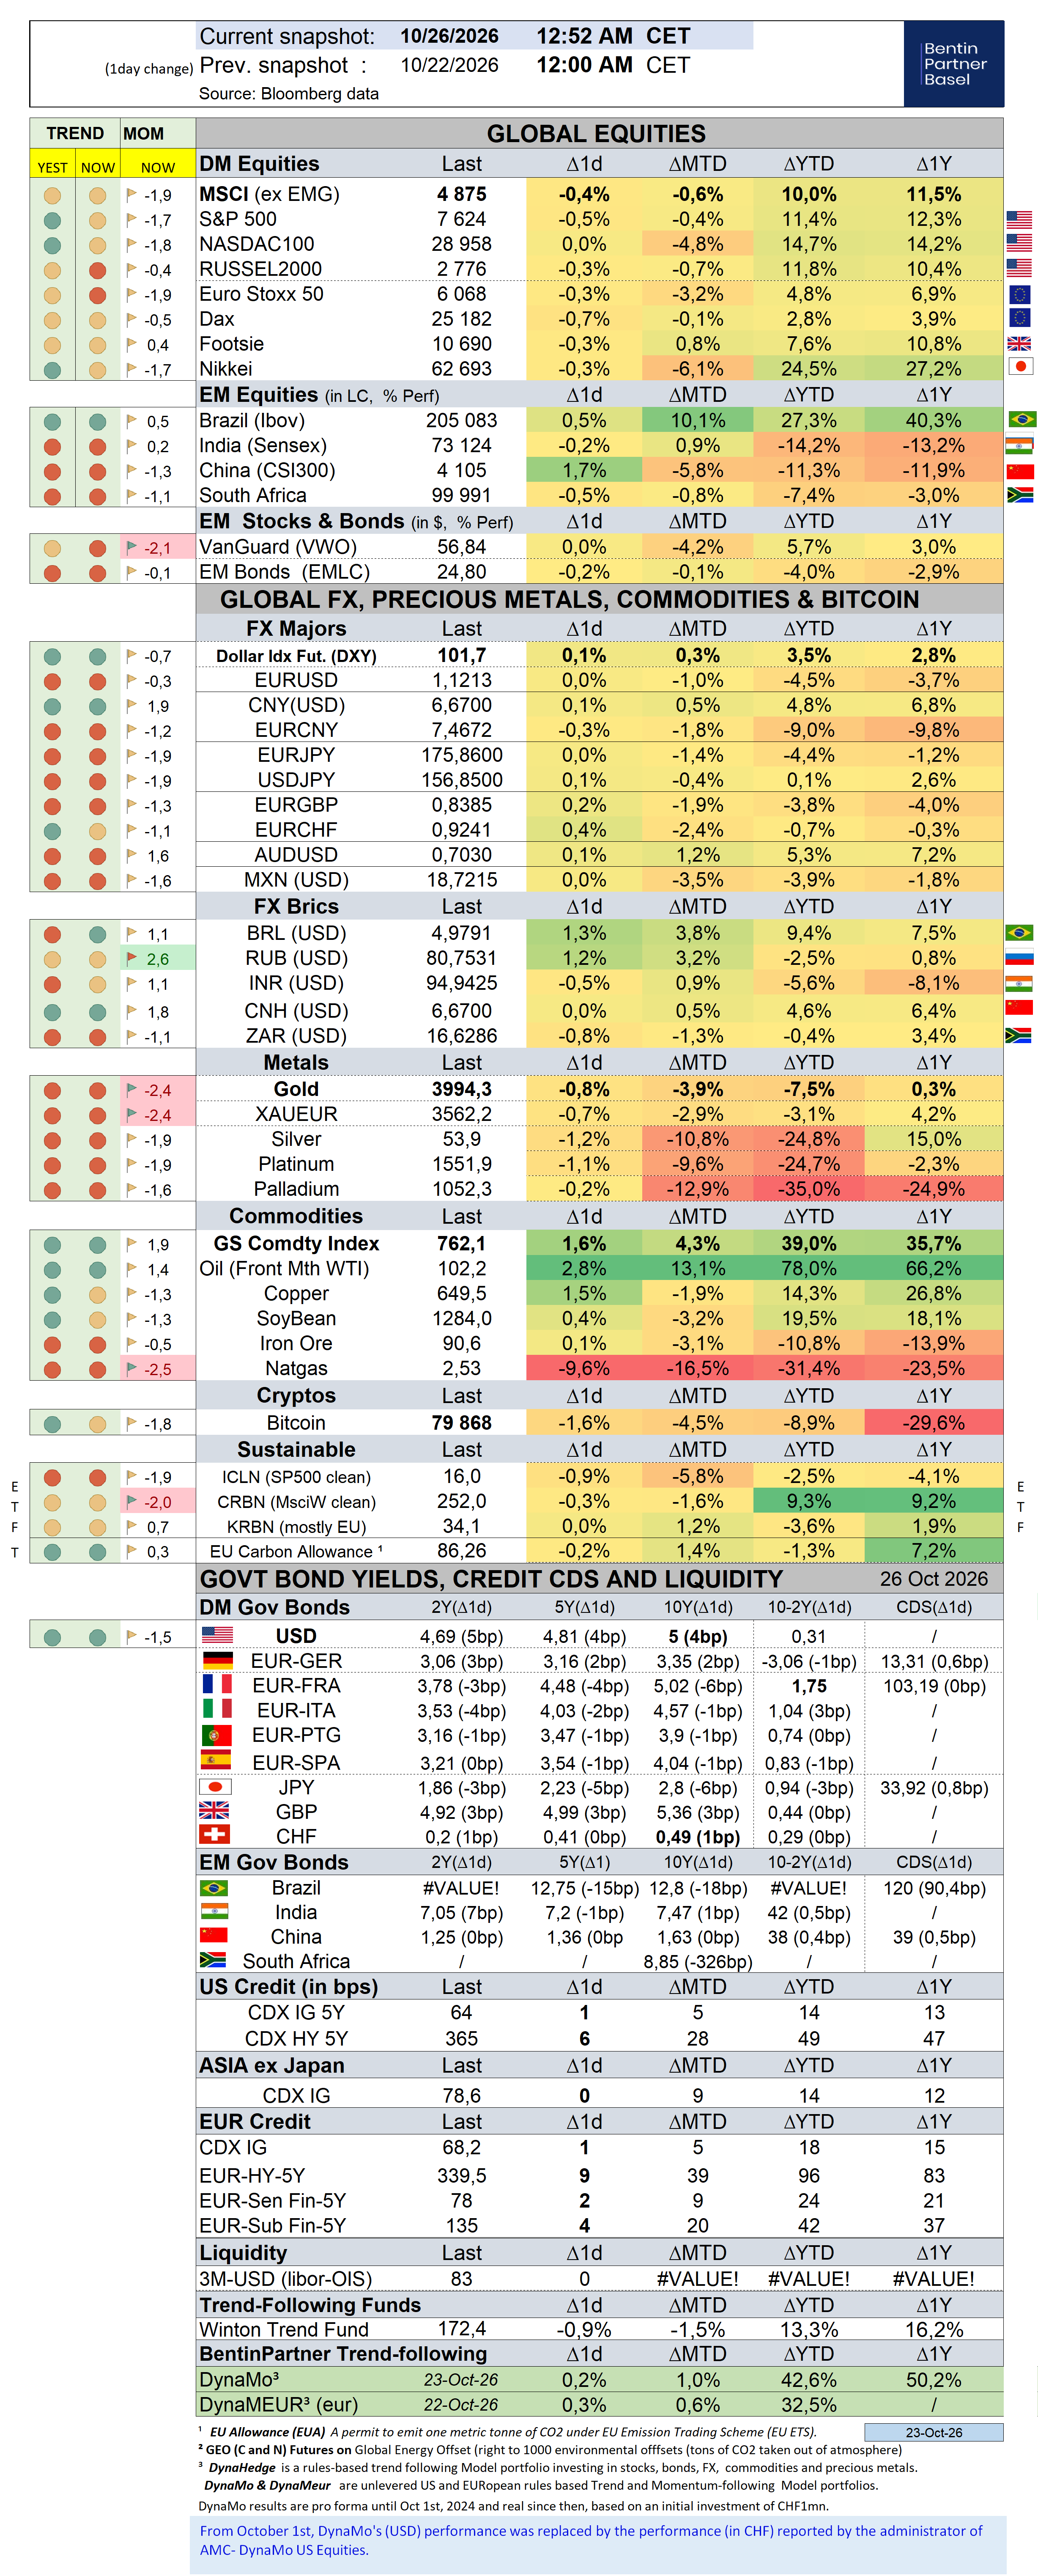
Over the past week, the S&P500 dropped -0,4% (11,4% YTD) while the Nasdaq100 dropped -0,8% (14,7% YTD). The US small cap index gained 2,0% (12,0% YTD). AAPL gained 1,2% (27,9%).
The Equally Weighed SP500 gained 1,1% (13,0% YTD), outperforming the S&P500 by 1,6%. The median SP500 YTD return closed the week at 8,4%.
Cboe Volatility Index sold off by -2,7% (30,1% YTD) to 19,45.
The Eurostoxx50 sold off by -2,3% (7,0%), underperforming the S&P500 by-1,8%.
Diversified EM equities (VWO) sold off by -2,1% (5,7%, Z-score -2,1), underperforming the S&P500 by-1,6%.
The Dollar DXY Index (UUP) measuring the USD performance vs. other G7 currencies gained 0,1% (7,1%) while the MSCI EM currency index (measuring the performance of EM currencies vs. the USD) gained 0,1% (4,2%).
10Y US Treasuries rallied -8bps (83bps) to 4,99%. 10Y Bunds dropped -8bps (49bps) to 3,35%. 10Y Italian BTPs underperformed rising 8bps (102bps) to 4,57%, underperforming Bunds by 16bps.
10Y French OAT's underperformed rising 21bps (146bps) to 5,02%, underperforming Bunds by 29bps.
US High Yield (HY) Average Spread over Treasuries climbed 6bps (71bps) to 3,37%. US Investment Grade Average OAS climbed 5bps (16bps, Z-score 2,3) to 1,00%.
In European credit markets, EUR 5Y Senior Financial Spread climbed 7bps (24bps, Z-score 2,7) to 0,78%.
Gold sold off by -3,4% (-7,4%, Z-score -2,8) while Silver sold off by -5,2% (-24,5%, Z-score -2,1). Major Gold Mines (GDX) sold off by -8,6% (-6,5%, Z-score -2,8).
Goldman Sachs Commodity Index gained 1,1% (52,5%). WTI Crude dropped -1,6% (77,6%).
Overnight in Asia…
Ø S&P future +6 points; Hong Kong +0.1%; Nikkei -0.8%; China -0.8%
Ø Asian stocks started on a soft tone following a volatile week on Wall Street that saw investors sell mega tech stocks including with a 10% decline of Meta after the company announced it was not lifting the pedal on AI investment and its intention to issue non-voting shares to fund this expansion (also for enabling M. Zucherberg to issue shares to pay for his wealth tax without losing voting rights).
Ø France dodged a downgrade at Moody’s staying at Aa3, on par with the UK on Friday and over the week end avoided a repeat of large-scale violence and looting that marred nationwide protests a week ago, suggesting the government’s decision to boost police numbers and contain marches paid off, Bloomberg reported. Albania’s capital of Tirana continued to be rocked by demonstrations against its prime minister, Bloomberg noted.
Ø Oil is trading marginally lower from a 6-month high after President D. Trump said “I have a decision to make: Do I finish it off, which would be very easy to do, or do I make a deal? That’s all,” Trump has suggested that US strikes on Iran could resume after the Nov. 3 midterm elections.
Ø President Lula unexpectedly won Brazil's runoff election with 51.76% to Flávio Bolsonaro’s 48.24%, according to Brazil's electoral court, delivering a blow to the movement built by former President Jair Bolsonaro. The Bolsonaro team asked the court to annul the runoff over voting issues, according to the latest news… which is not entirely surprising… Brazilian assets will start the week sharply lower.
Ø Serbian longtime leader Aleksandar Vucic surprisingly conceded defeat in a snap vote, handing victory to a student-led movement, the Student List, which won more than 2 million votes in a country of 6.5mn.

To learn more about our AMC offering and how to invest in the trend-following, visit our Advisory web page.
If you like our Weekly, you will love our Daily!
Consider a subscription today. Discounts may apply!
To learn more about us and how we can assist you, check our website
Important Disclaimer
© Copyright by BentinPartner LLC. This communication is provided for information purposes only and for the recipient's sole use. Please do not forward it without prior authorization. It is not intended as a recommendation, an offer, or solicitation for the purchase or sale of any security or underlying asset referenced herein or investment advice. Investors should seek financial advice regarding the suitability of any investment strategy based on their objectives, financial situation, investment horizon, and particular needs. This report does not include information tailored to any particular investor. It has been prepared without any regard to the specific investment objectives, financial situation, or particular needs of any person who receives this report. Accordingly, the opinions discussed in this report may not be suitable for all investors. You should not consider any of the content in this report as legal, tax, or financial advice. The data and analysis contained herein are provided "as is" and without warranty of any kind. BentinPartner LLC, its employees, or any third party shall not have any liability for any loss sustained by anyone who has relied on the information contained in any publication published by BentinPartner LLC. The content and views expressed in this report represent the opinions of Marc Bentin and should not be construed as a guarantee of performance with respect to any referenced sector. We remind you that past performance is not necessarily indicative of future results. Although BentinPartner LLC believes the information and content included in this report have been obtained from sources considered reliable, no representation or warranty, express or implied, is provided in relation to the accuracy, completeness, or reliability of such information. This Report is also not intended to be a complete statement or summary of the industries, markets, or developments referred to in the Report.

Comments