More Destructive Destruction...
- Marc Bentin
- Feb 16
- 8 min read

Updated: Feb 21
BentinPartner Weekly

Dear Reader,
Please find below our latest Weekly Trend Report.
Have a nice start of the week.
Marc Bentin,
Bentinpartner GmbH
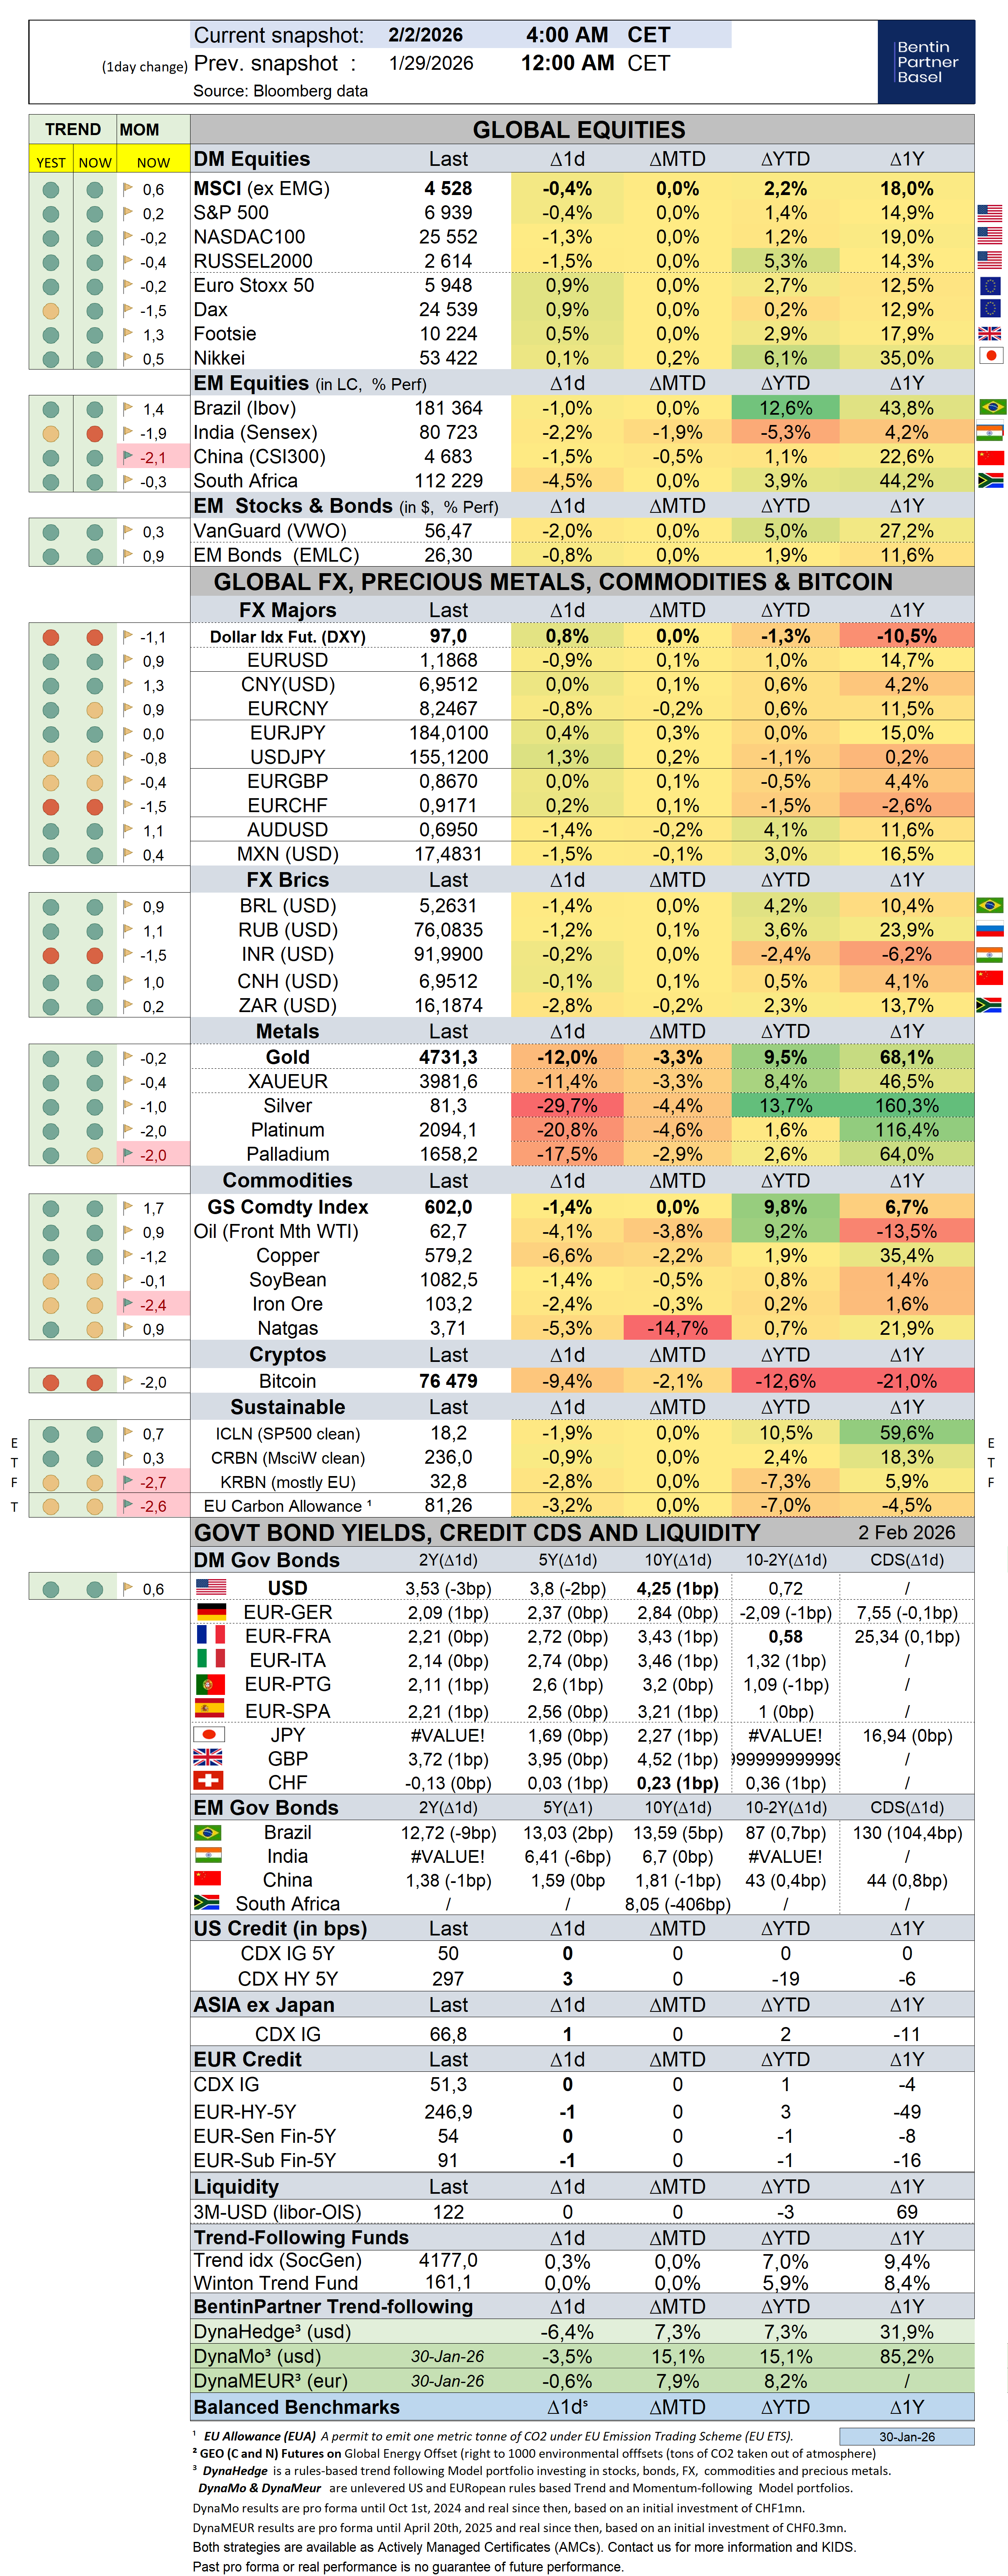
More tech selling last week erased the SP500 gains for the year, pushing the Nasdaq into negative territory as more investors grew worried that more businesses will be potentially swept aside by new AI applications.
What started with software and video companies and their private equity firms’ backers continued last week after Anthropic releasing tools for lawyers and financial researchers/planners hammered share prices of US financial, brokerage and even insurance firms following another program of Open AI, little know Altruist Corp.
This added to the woes affecting the so called hyper-scalers themselves including the biggest AI winner, Alphabet which is also down -11% from its recent peak with investors growing concerned about their lofty valuation (their share price has led the stock market for the past three years) and the recent pace of capital spending by big tech firms which consume 100% of their operating cash flows (from 40% on average over the past 10 years) in addition to debt and equity financing.
Adding to last week’s seismic moves, commercial real estate stocks nosedived Thursday with traders freaking about risk to demand for office space …from higher use of AI tools, broadening a selloff that began last Wednesday as shares of CBRE dropped 8.8%, bringing the two-day decline to 20% in the worst selloff since 2020.
Shares from Private Credit firms continued to signal caution with Apollo losing 6.0% last week (-13.6% YTD), and Ares dropping 1.8% (-17.2% YTD) while KKR declined -1.4% (20.2%).
Most importantly as well, bank and financial stocks came under heavy selling pressure last week with the KBW Bank Index shedding -5.5%, the largest decline since “liberation day” week April 4th and the Broker/Dealers slumping 3.7% (as Charles Schwab dropped -10.8% and Citi 9.6%).
European Banks stocks (STOXX index) were not immune, also shedding 5.5%, amid AI worries, leading our European Trend-following Model to significantly reduce exposure to the Bank shares that contributed to a large extent to last year’s stellar European stock market performance.
That being said, sections of the US equities market performed well despite the “AI scare trades” with Utility stocks surging 6.7% last week (YTD + 8.6%).
Also offering some contrast, South Korea’s KOSPI surged a 8.2% last week (inflating YTD gains to 113% with Japan also gaining 5.8% in Japan (despite JPY strength).
While the SP500 lost all gains for the year, shorting as an hedge has not been easy either as the Goldman Sachs Most Short Index gained 6.8% so far in 2026 despite the Mag7 Index being hit by 3.2% last week, boosting 2026 losses to 7.2%.
On the bond side, US treasuries strengthened markedly last week with 10Y yields dropping -16 bps to 4.05%, the lowest for the year, supported by a weak December Retail Sales report (flat mom), followed by a contained January CPI report.
In contrast, January payrolls creation was “twice as strong as expected”, gaining 130k non farm jobs but this release was largely discarded as a data print lacking credibility (due to year in year out downward revisions), failing to discard the impression that the labor market is weakening.
Credit spreads widened again last week, reflecting heavy corporate issuance coupled to lingering concerns about the economy, cracks in AI, and continued underperformance from private credit firms which were also accompanied by weaker banks and brokerage firms on both sides of the Atlantic.
In the meantime, a new AI borrowing frenzy and largest wave of corporate bond supply in history hit the market with Big Tech firms rushing to raise unprecedented amounts of money (400bn expected this year from USD170bn last year) to build out artificial intelligence. Quite noteworthy was Alphabet borrowing program that included a 100y bond last week…The more tech companies borrow, the greater the potential pressure on bond valuations will be with the securities already expensive by historical standards, trading at close to their tightest spreads since the late 1990s, Bloomberg noted.
In other words, the US Treasury market rally last week (German 10Y Bund yields also declined 8bps) was a safe haven bid accompanying a deleveraging action that was equally visible in cryptos despite a late recovery on Friday.
For the week, the dollar index dropped 0.7% to 96.915 while JPY gained 3% last week, bringing further evidence that a deleveraging is taking place with more “JPY carry trade” unwind becoming only too obvious.
CNY also rallied to its strongest level since May 2023 after China was said to have asked banks to limit their holdings of US Treasuries and President XI expressed some interest in a strong currency, only reinforcing a global trend of diversification away from the dollar which could also accelerate the repatriation of capital into Chinese assets.
Gold and silver remained volatile last week, especially silver.
Market participants are always keen to scream at market manipulation on silver (including ourselves).
On certain occasions, however, measures to bring sanity back into the market may be necessary to reduce volatility. This is what happened to Silver in China last week when the SHFE’s moved by effectively restricting hedge‑fund activity in Shanghai’s silver market. These interventions triggered a steep drop in Shanghai silver futures.
China also moved to block fresh money from entering the UBS SDIC Silver Futures Fund (the country’s only pure silver fund) after a violent price surge.
As a result, many participants in China saw their hedging open‑interest limits automatically converted to near‑delivery limits being set to zero, preventing non‑member institutions, a category that includes many hedge funds, from building, holding or rolling large hedging positions near delivery.
The catalyst was not a typical macroeconomic report or waning industrial demand, but a decisive move by the market’s regulator.
Liquidity briefly evaporated in the front-month contracts and the exchange emergency intervention successfully achieved its short-term goal of reducing speculative heat, at the cost of significant mark-to-market losses for leveraged longs…
Data from the exchange showed a notable drop in aggregate open interest following the event, confirming the exodus of speculative capital.
This caused a large liquidation selloff which also impacted the CME which saw its open interest divided by three since the recent extremes, meaning that delivery problems on the CME for that expiration month are unlikely to endanger the inventories or the contract’s viability for that matter and thus won’t necessitate much more efforts to drag the price lower, in our view.
Besides these near term technical considerations and headwinds which may continue for a week or two, a (monetary) question worth asking remains how much more money will be printed during the next crisis, considering that the Fed responded to the 2008 bursting bubble by doubling its balance sheet with $1 TN of QE and later doubled its balance sheet again to almost $4.5 TN between 2011 and 2014, only to double it again during the 2020 pandemic crisis when another $5 TN monetary inflation was unleashed that led to an everything rally speculation, spearheaded by AI excesses of epic proportion which are now showing signs of stress…and deleveraging.
My intuition is a lot and the reason why I remain more bullish on gold (and silver) than ever…
Technically, more efforts could be made to drag gold and especially silver down during China’s golden week but I would take any further selloff as a gift and so will central banks that need to reload (at least gold) and can only buy when prices temporarily go down.
Over the past week, the S&P500 dropped -1,3% (0,0% YTD) while the Nasdaq100 dropped -1,3% (-2,0% YTD). The US small cap index dropped -0,8% (6,8% YTD). AAPL shed -8,0% (-5,9%).
The Equally Weighed SP500 gained 0,3% (5,9% YTD), outperforming the S&P500 by 1,6%. The median SP500 YTD return closed the week at 7,6%.
Cboe Volatility Index rallied 16,0% (37,8% YTD) to 20,6.
The Eurostoxx50 dropped -0,1% (3,3%), outperforming the S&P500 by 1,2%.
Diversified EM equities (VWO) gained 0,9% (7,4%), underperforming the S&P500 by 2,1%.
The Dollar DXY Index (UUP) measuring the USD performance vs. other G7 currencies dropped -0,7% (-0,8%) while the MSCI EM currency index (measuring the performance of EM currencies vs. the USD) gained 0,6% (1,0% ).
10Y US Treasuries rallied -16bps (-12bps, Z-score -2,8) to 4,05%. 10Y Bunds dropped -9bps (-10bps, Z-score -2,5) to 2,76%. 10Y Italian BTPs rallied -10bps (-19bps, Z-score -2,3) to 3,36%, outperforming Bunds by -1bps.
10Y French OAT's rallied -11bps (-22bps, Z-score -2,1) to 3,34%, outperforming Bunds by -2bps.
US High Yield (HY) Average Spread over Treasuries climbed 14bps (14bps, Z-score 2,4) to 2,80%. US Investment Grade Average OAS climbed 4bps (2bps, Z-score 2,3) to 0,86%.
In European credit markets, EUR 5Y Senior Financial Spread climbed 2bps (1bps) to 0,55%.
Gold gained 1,6% (16,7%) while Silver dropped -0,5% (8,0%). Major Gold Mines (GDX) rallied 6,7% (21,2%).
Goldman Sachs Commodity Index dropped -0,5% (6,8%). WTI Crude dropped -1,0% (9,5%).
Overnight in Asia…
Ø S&P future +11 points; Hong Kong +0.5%; Nikkei +0.2%; China -1.2%
Ø Russian and Ukrainian negotiators are expected to gather again in Geneva on Tuesday for peace talks (and in the meantime exchanged heavy drone attacks over the week end).

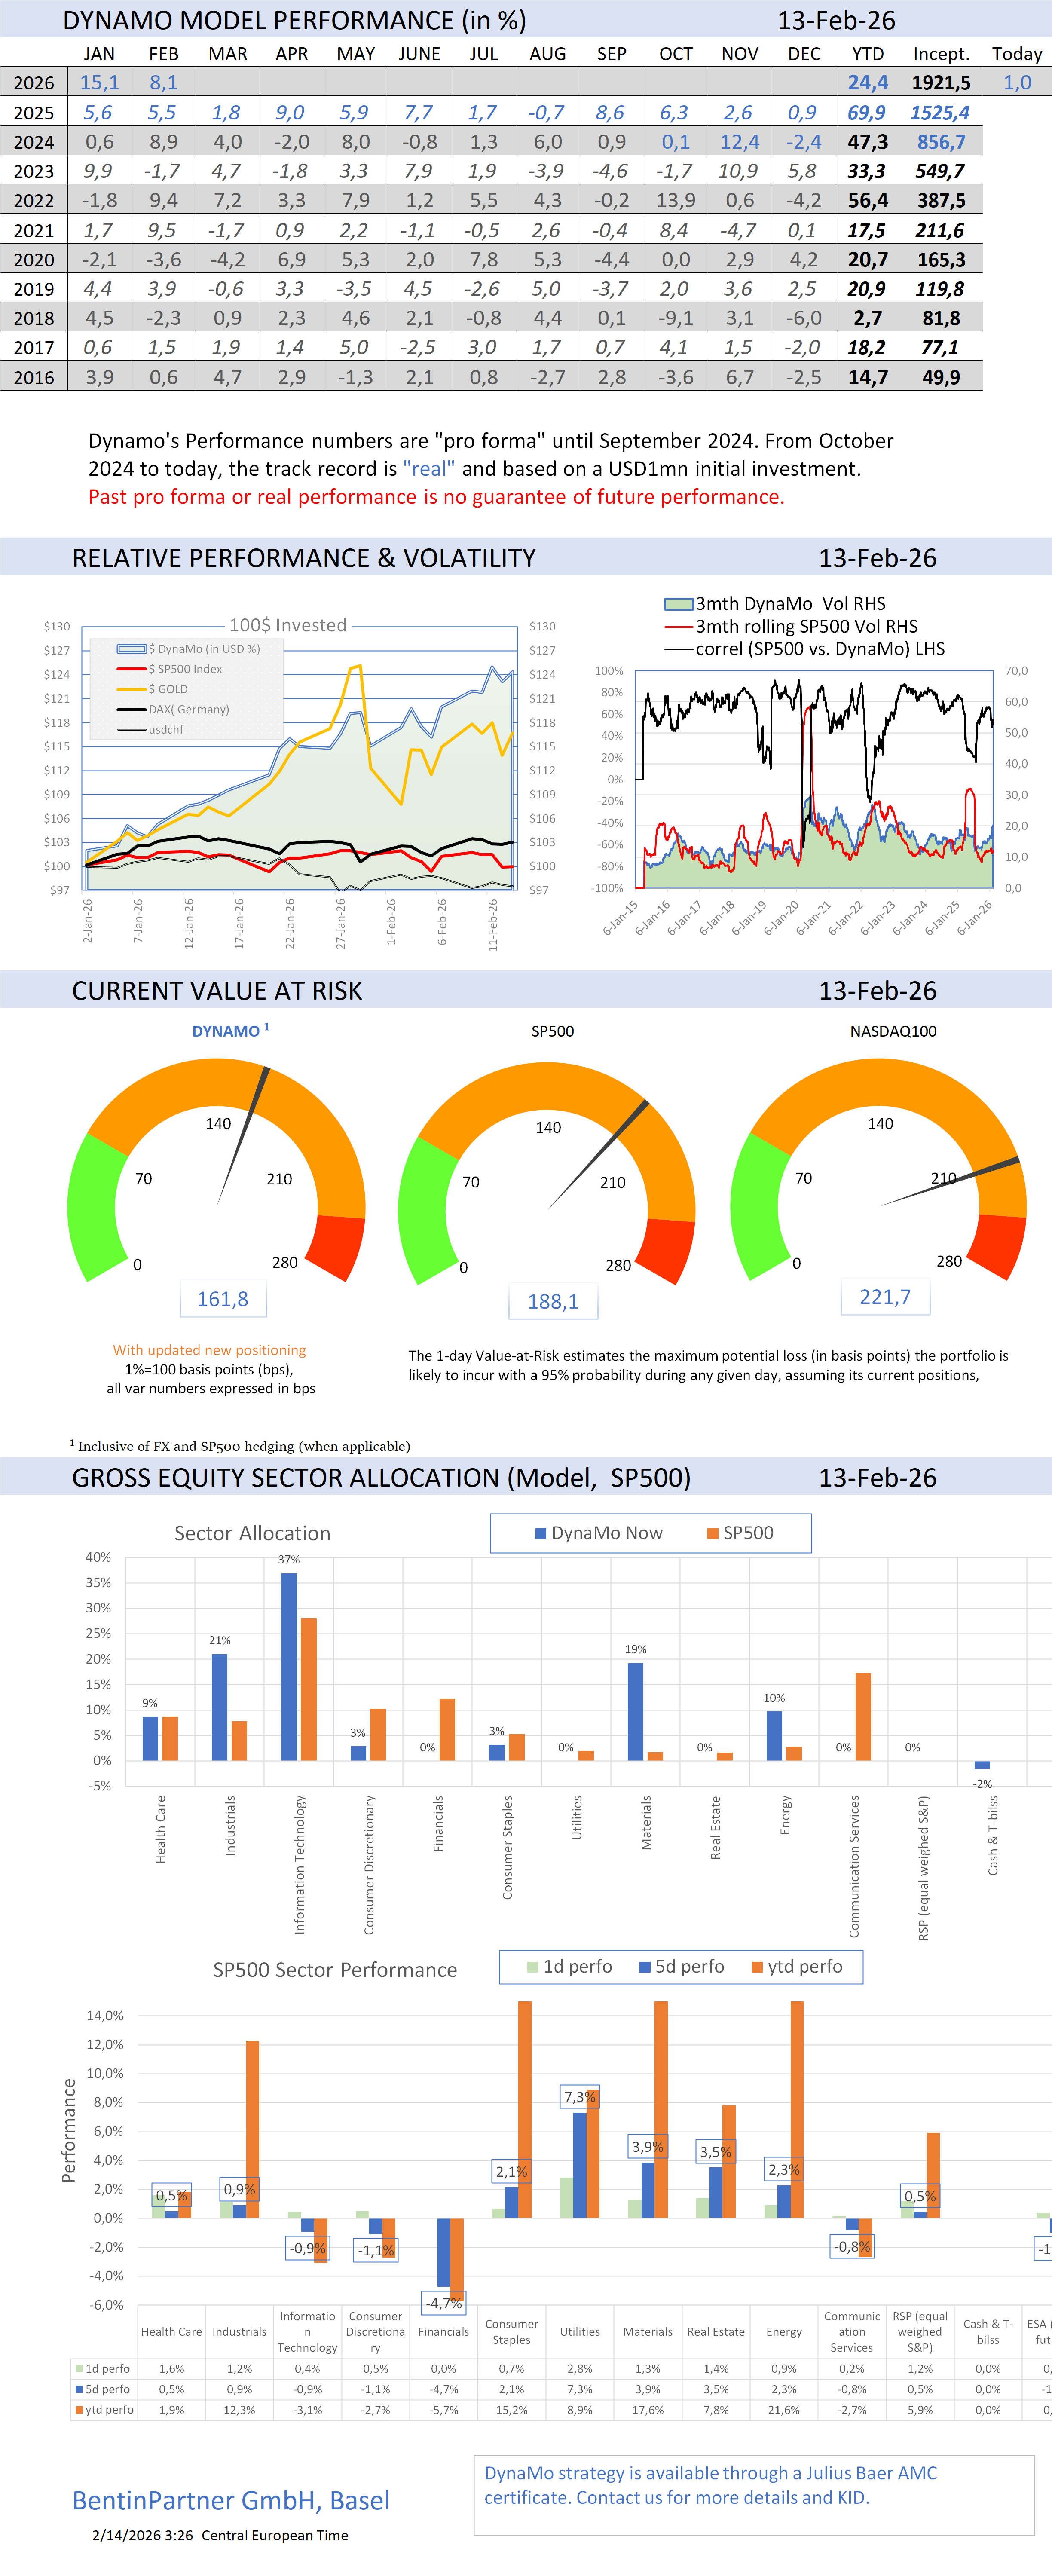
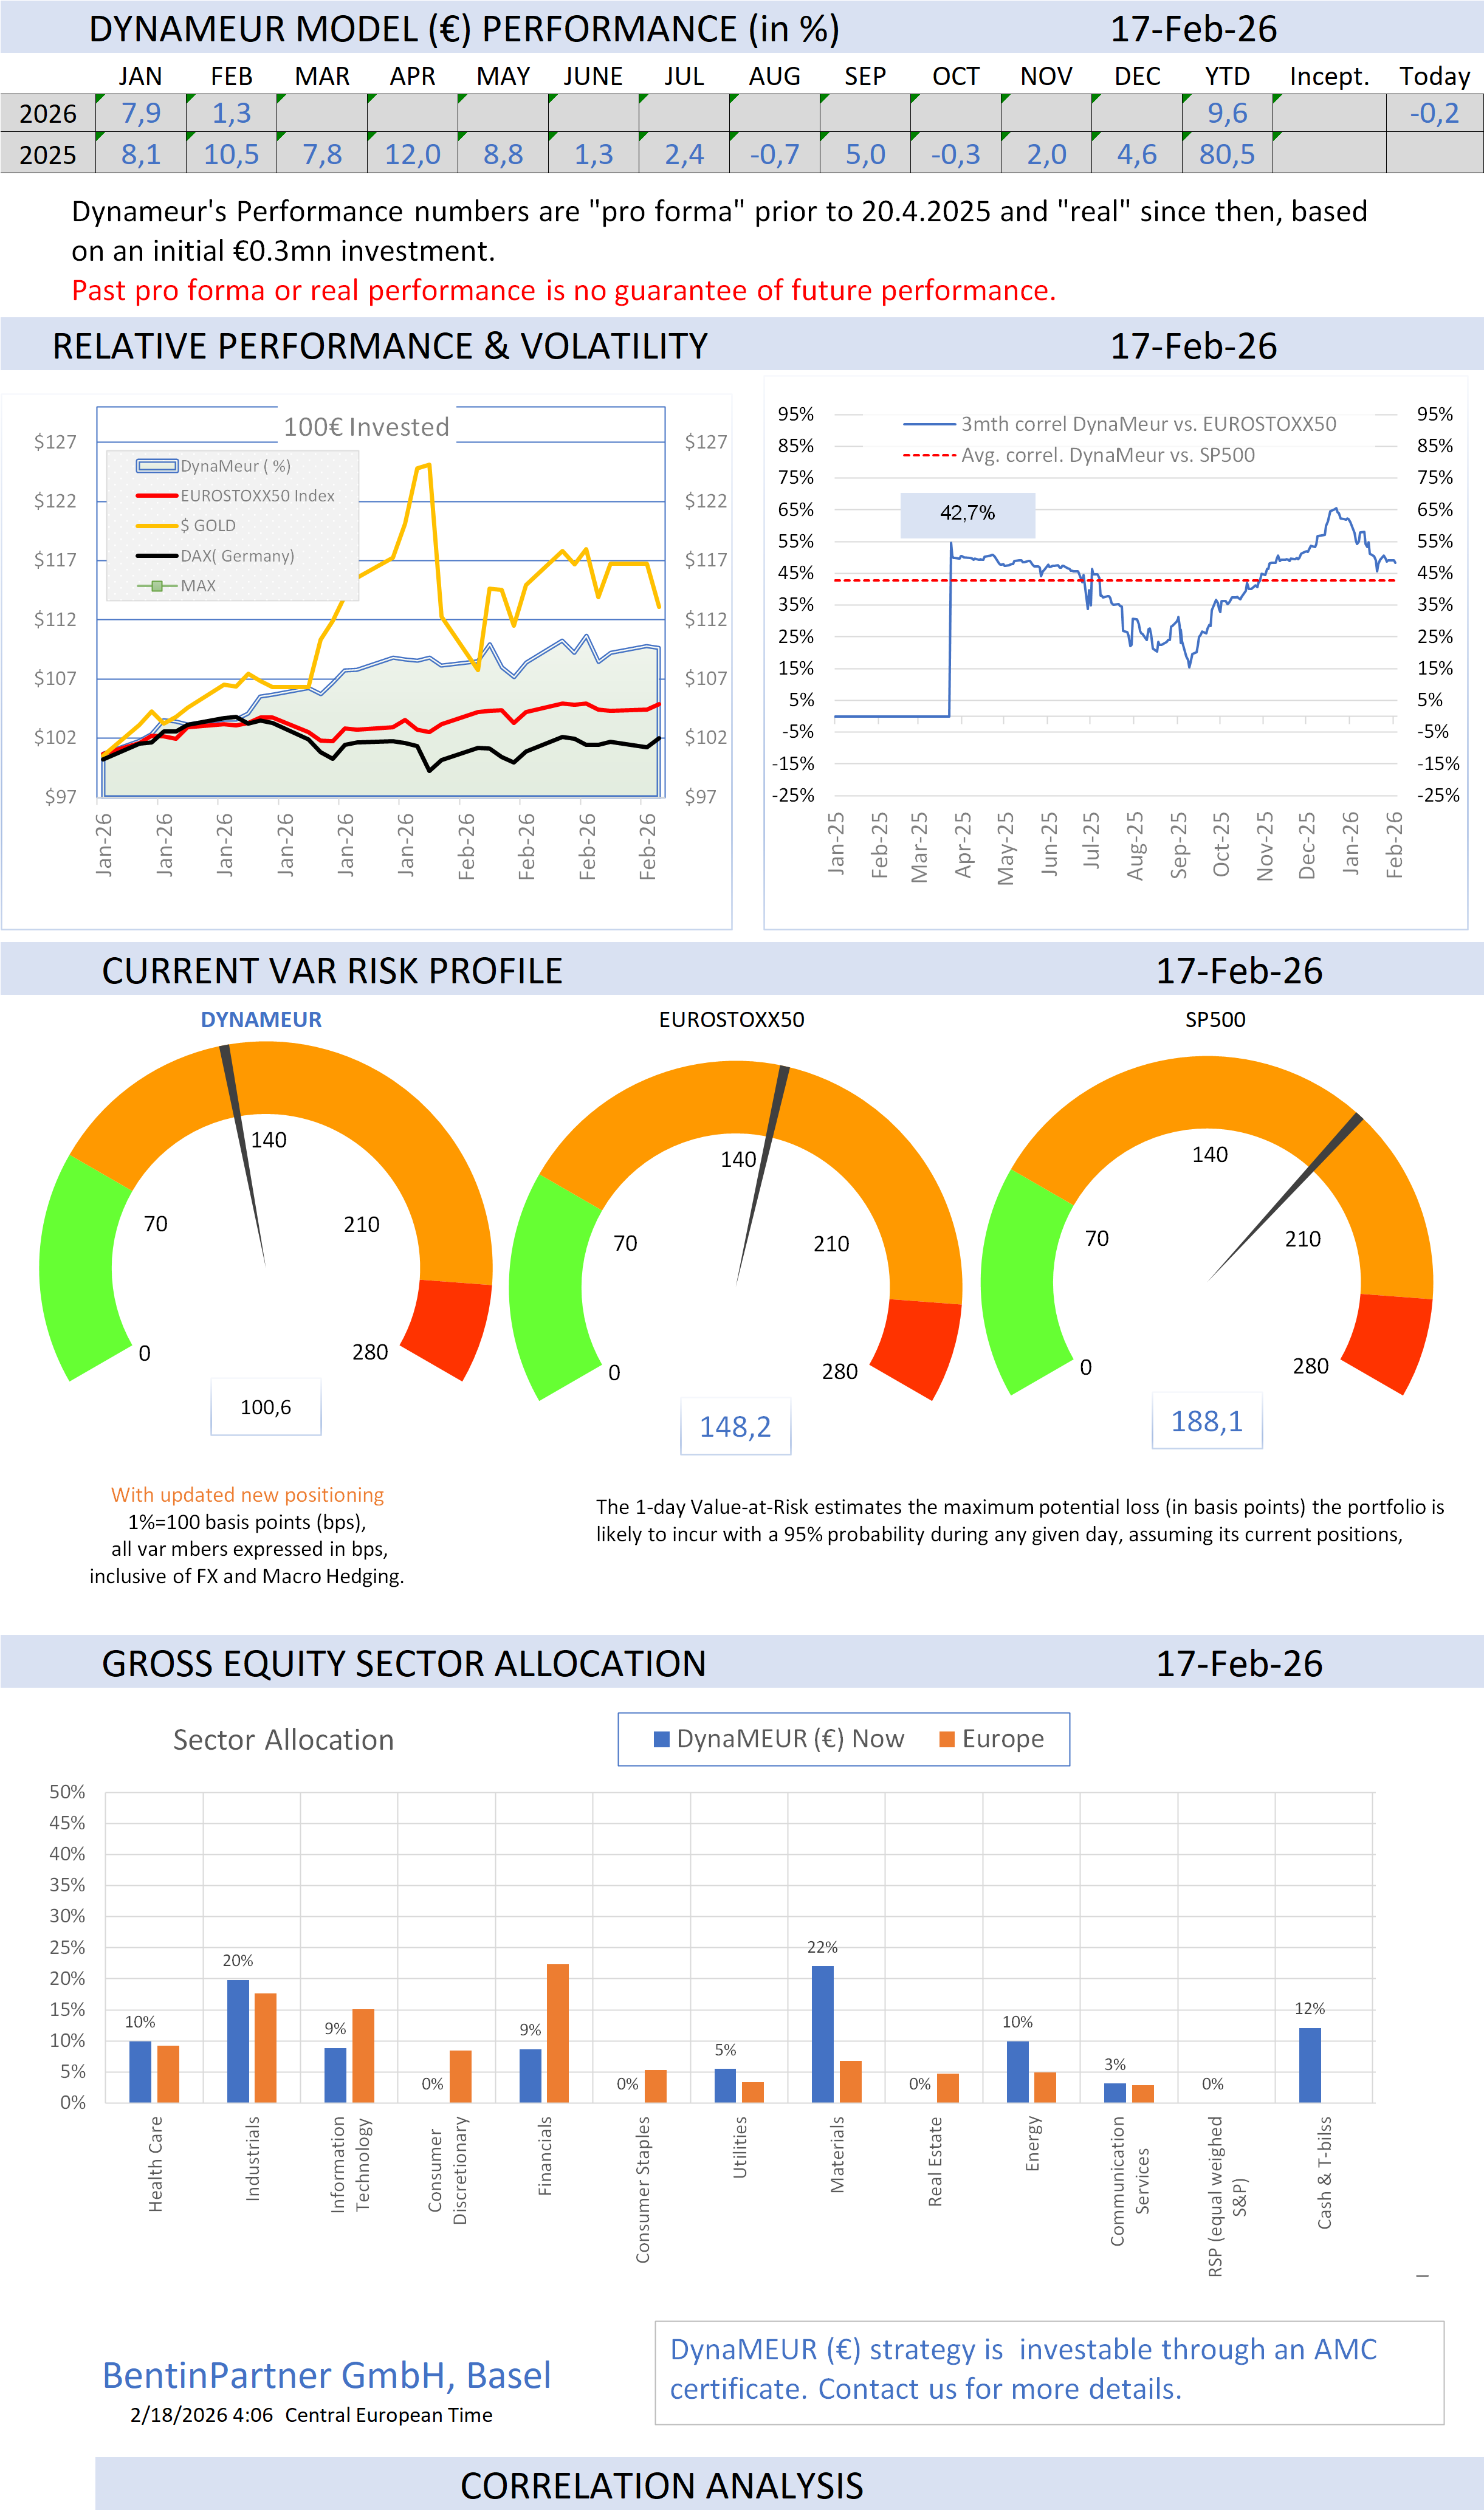
To learn more about our AMC offering and how to invest in the trend-following, visit our Advisory web page.
If you like our Weekly, you will love our Daily!
Consider a subscription today. Discounts may apply!
To learn more about us and how we can assist you, check our website
Important Disclaimer
© Copyright by BentinPartner LLC. This communication is provided for information purposes only and for the recipient's sole use. Please do not forward it without prior authorization. It is not intended as a recommendation, an offer, or solicitation for the purchase or sale of any security or underlying asset referenced herein or investment advice. Investors should seek financial advice regarding the suitability of any investment strategy based on their objectives, financial situation, investment horizon, and particular needs. This report does not include information tailored to any particular investor. It has been prepared without any regard to the specific investment objectives, financial situation, or particular needs of any person who receives this report. Accordingly, the opinions discussed in this report may not be suitable for all investors. You should not consider any of the content in this report as legal, tax, or financial advice. The data and analysis contained herein are provided "as is" and without warranty of any kind. BentinPartner LLC, its employees, or any third party shall not have any liability for any loss sustained by anyone who has relied on the information contained in any publication published by BentinPartner LLC. The content and views expressed in this report represent the opinions of Marc Bentin and should not be construed as a guarantee of performance with respect to any referenced sector. We remind you that past performance is not necessarily indicative of future results. Although BentinPartner LLC believes the information and content included in this report have been obtained from sources considered reliable, no representation or warranty, express or implied, is provided in relation to the accuracy, completeness, or reliability of such information. This Report is also not intended to be a complete statement or summary of the industries, markets, or developments referred to in the Report.
Comments