Widening Crocodile Jaws..
- Marc Bentin
- May 18
- 6 min read

BentinPartner Weekly

Dear Reader,
Please find below our latest Weekly Trend Report.
Have a nice start of the week.
Marc Bentin,
Bentinpartner GmbH
While US stocks managed to close marginally higher and for the seventh consecutive week (despite some serious roller coaster action), the bond market sell off last week was global with yields rising in the UK, Japan, Germany, Europe as a whole and Australia as a confluence of factors conjured from a political crisis in the UK, supplementary fiscal budget in Japan (30Y yields rose above 4% last week and 4.2% this morning for the first time ever), rising CPI and PPI and massive corporate (AI related) debt issuance in the US while European Central bankers suggested rates might have to go higher to combat mounting inflation (despite a stagnating economy bordering with recession).
On Friday G7 leaders said they were going to discuss the global bond selloff, not that they can do anything about it, except cutting rates and quick starting QE amidst rising inflation, which at least over the near term, remains unlikely. S. Bessent said the global back up in yields is perhaps due to markets pricing in “a short-term blip in inflation”.
Bond losses were even sharper in EM countries (Brazil surged 55bps, Mexico 25bps and Turkey 124bps).
With 10y yields above 4.5% (and Fed Funds expectations now pricing a 50% probability of a 25bps rate hike by the end of the year), the stock market rally may become vulnerable along with the “broader risk complex” as the jaws of the crocodile (of stocks going higher and bonds going down) threaten to close.
It is worth noting again that although credit markets held strong (the spread of corporate bonds more than their price which was still dragged down by a sharp increase in global govt yields), the stock market rally has been narrow this month with most gains concentrated on a narrow list of tech stocks while 8 of 11 sectors are showing losses for the month. Positioning also seems stretched for retail (and systematic investors) with a survey of BoA showing that retail private clients hold the smallest cash on record (at 9.8%) and a record long in equities (65.7%).
That outperformance came to an abrupt halt first last Monday then again on Friday.
As I suggested on Friday, perhaps the AI Bubble is also starting to look like 1999 on steroids.
The difference between Monday’s sharp selloff and Tuesday’s sharp recovery was a single Bloomberg headline that OpenAI was valued at USD 900bn after a fresh USD 30bn raise. With only one number, suddenly hundreds of billions in market cap evaporate, then reappear, as if nothing matters anymore.
The Economist probably nailed it: unlisted AI shares are being used as monopoly money to pay hyperscalers… who then see their own valuations skyrocket because they hold those same unlisted shares. A self‑feeding loop. A feedback machine. A bubble factory.
And like all bubbles, it will end the same way, when early investors cash out. Maybe around the IPOs of OpenAI, Anthropic, SpaceX. Maybe sooner.
For what it is worth the following two charts try to approximate the exponential increase of Anthropic with a back of the envelope AI calculation projecting that 10’000 people, founders and employees at companies like Open A, Anthropic and Nvidia, have hit retirement wealth of well over USD20mn.
Prices below are not public prices, just guestimates based on previous, likely crazy rounds of funding.
SpaceX has announced on Friday, a 5/1 stock split even before being IPOed…to be sure to be able refill small players’ 401k…
Meanwhile, bond markets were screaming with US inflation is rising again (CPI yoy rose 3.8% from 3.3% last month, PPI yoy climbed to 6% from 4.3% last month), Hyperscalers borrowing like there’s no tomorrow, crowding out public and private borrowing and Private‑credit cracks widening, despite a generally resilient credit market otherwise.
The setup certainly felt unstable while the AI narrative still felt euphoric. And euphoria is always the last stage.
In that context, the dollar caught a bid, gaining 1.4% on the week as yields rose and risk aversion settled in while oil gained 10%.
The context was near term deleterious to precious metals as well.
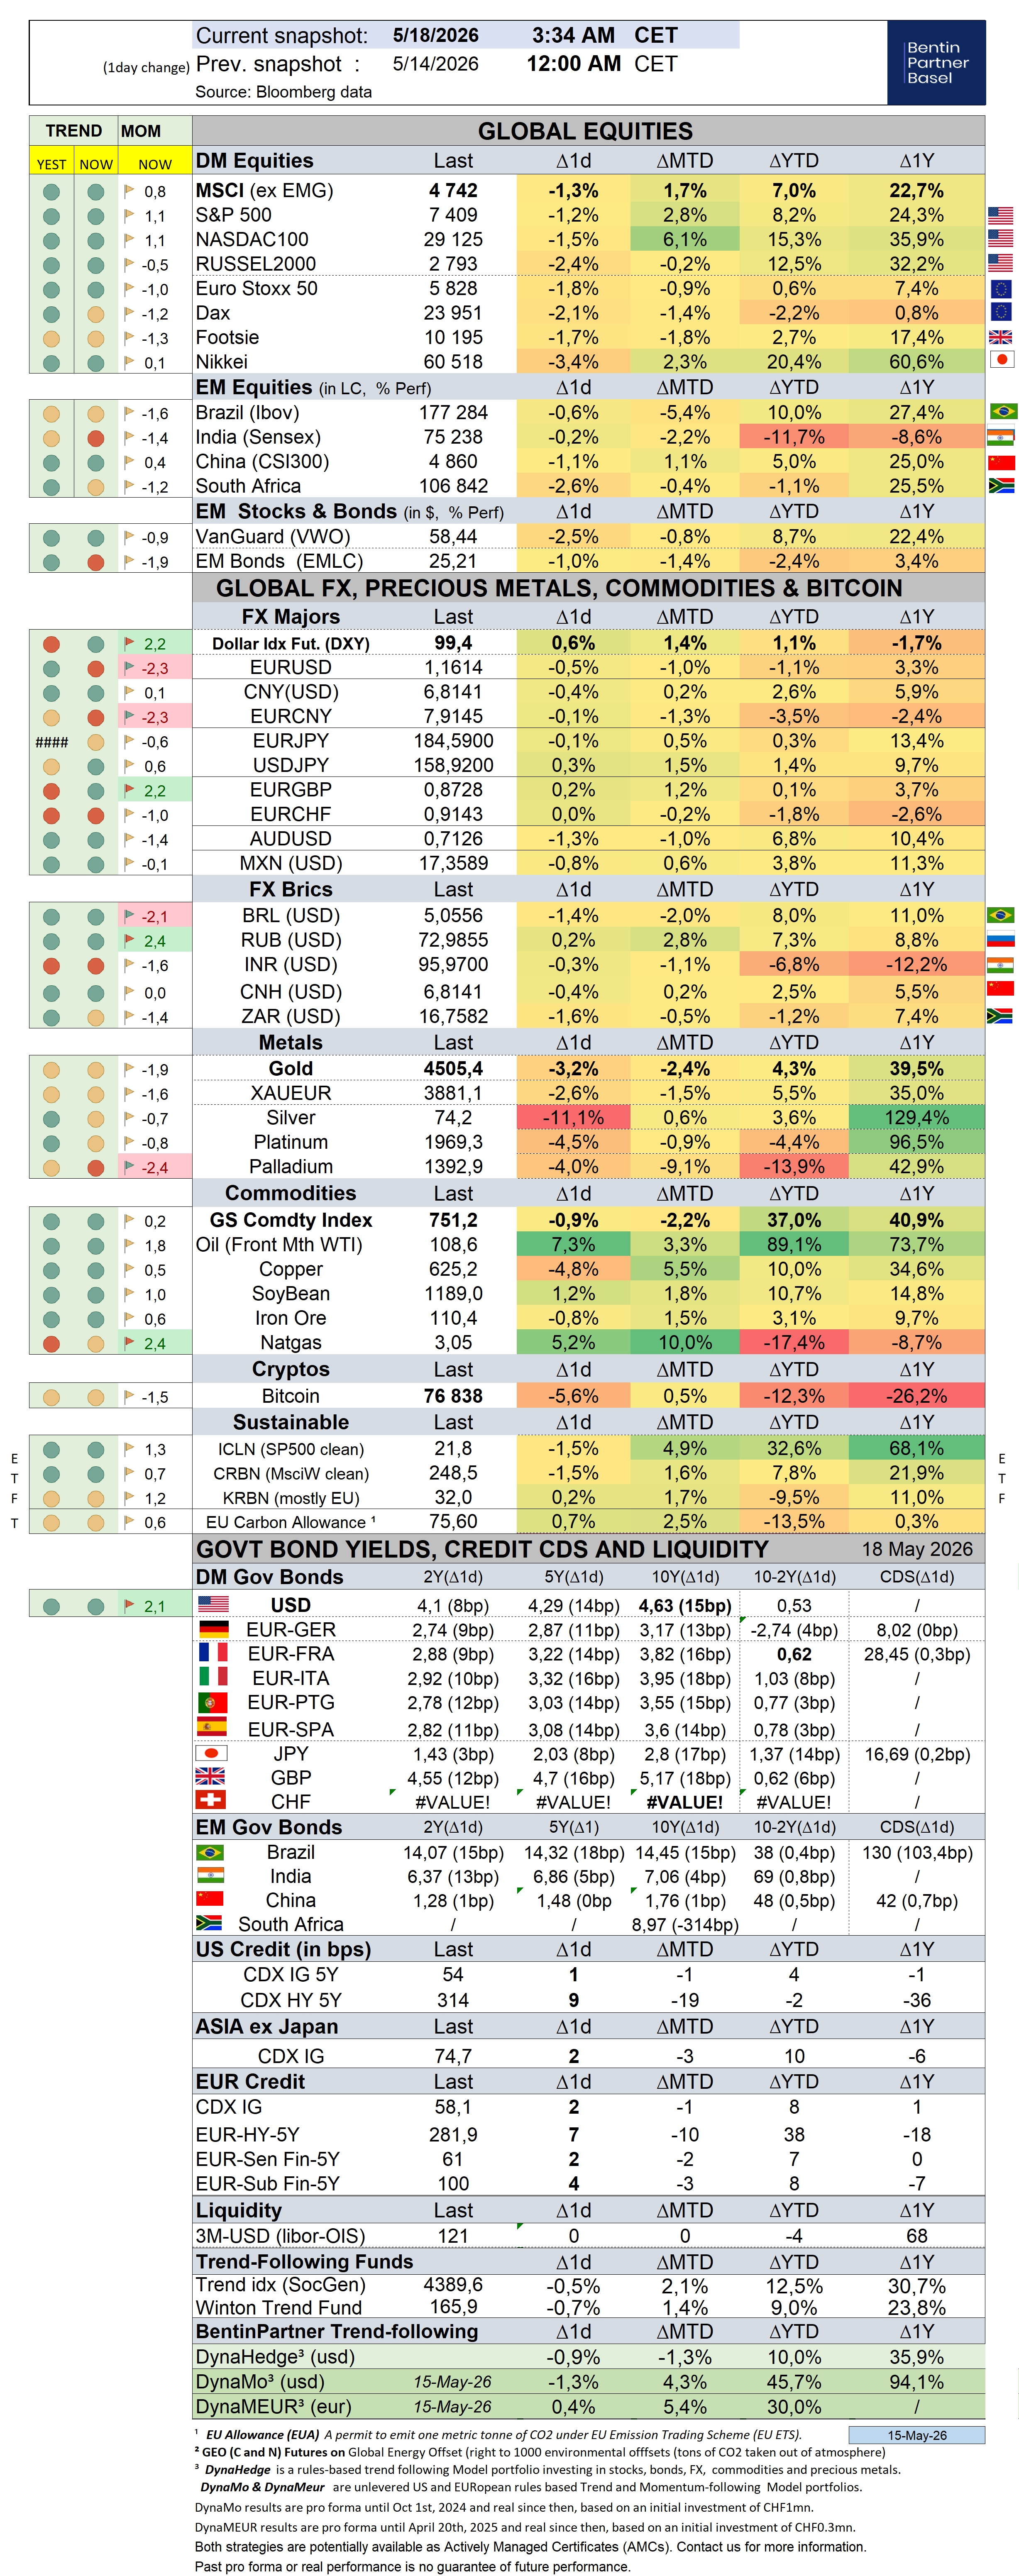
Over the past week, the S&P500 gained 0,2% (8,4% YTD) while the Nasdaq100 dropped -0,3% (15,4% YTD). The US small cap index sold off by -2,3% (12,8% YTD). AAPL rallied 2,4% (10,4%).
The Equally Weighed SP500 dropped -1,2% (5,2% YTD), underperforming the S&P500 by-1,5%. The median SP500 YTD return closed the week at 1,2%.
Cboe Volatility Index rallied 7,2% (23,3% YTD) to 18,43.
The Eurostoxx50 dropped -1,2% (2,0%), underperforming the S&P500 by-1,4%.
Diversified EM equities (VWO) sold off by -3,5% (8,7%), underperforming the S&P500 by-3,7%.
The Dollar DXY Index (UUP) measuring the USD performance vs. other G7 currencies gained 1,6% (2,7%, Z-score 2,8) while the MSCI EM currency index (measuring the performance of EM currencies vs. the USD) dropped -0,8% (0,6%).
10Y US Treasuries underperformed with yields rising 21bps (46bps, Z-score 2,5) to 4,63%. 10Y Bunds climbed 16bps (31bps , Z-score 2,6) to 3,17%. 10Y Italian BTPs underperformed rising 22bps (40bps ) to 3,95%, underperforming Bunds by 6bps.
10Y French OAT's underperformed rising 20bps (26bps , Z-score 2,4) to 3,82%, underperforming Bunds by 4bps.
US High Yield (HY) Average Spread over Treasuries climbed 1bps (1bps) to 2,67%. US Investment Grade Average OAS dropped -5bps (-5bps, Z-score -2,4) to 0,79%.
In European credit markets, EUR 5Y Senior Financial Spread climbed 2bps (7bps) to 0,61%.
Gold sold off by -4,8% (4,3%) while Silver sold off by -13,7% (3,6%). Major Gold Mines (GDX) sold off by -7,7% (1,8%).
Goldman Sachs Commodity Index rallied 2,9% (39,5%). WTI Crude rallied 10,6% (88,9%).
Overnight in Asia…
Ø S&P future -47 points; Hong Kong -1.4%; Nikkei -0.9%; China -0.7%
Ø US futures and Asian stocks extended their slide from record highs after the global selloff in bonds continued with 10Y JGB’s adding 8bps on concerns of extra debt issuance as Prime Minister Sanae Takaichi is set to announce plans soon to compile an extra budget
Ø US10Y climbed by as much as the deadlock over Iran continued driving oil prices 2% higher (to USD111) rekindling inflation fears (and now fears that the Fed might tighten).
Ø A drone attack sparked a fire at a United Arab Emirates nuclear plant, underscoring the fragility and President Trump repeatedly threatening to resume the bombing campaign, saying Iran will have to make concessions or "be hit badly".TIME IS OF THE ESSENCE!”, he said.
Ø Russian President Vladimir Putin is due to visit China on Tuesday and Wednesday, following D. Trump’s visit to China.
Ø Moskow was hit by the largest drone attack in a year on Sunday, leaving four dead and dozens injured. Reports said the attack was the first in 4+ years of war that Ukraine struck directly a refinery in Moskow. Russian forces subsequently launched a combined drone and missile attack on Ukraine's central and southern region overnight.
Ø China’s retail sales climbed in April by only 0.2% yoy (vs. +2% expected) while industrial production rose 4.1% (vs. 6% expected). The surveyed urban jobless rate eased to 5.2%, after hitting a one-year high of 5.4% in March, Bloomberg reported.
To learn more about our AMC offering and how to invest in the trend-following, visit our Advisory web page.
If you like our Weekly, you will love our Daily!
Consider a subscription today. Discounts may apply!
To learn more about us and how we can assist you, check our website
Important Disclaimer
© Copyright by BentinPartner LLC. This communication is provided for information purposes only and for the recipient's sole use. Please do not forward it without prior authorization. It is not intended as a recommendation, an offer, or solicitation for the purchase or sale of any security or underlying asset referenced herein or investment advice. Investors should seek financial advice regarding the suitability of any investment strategy based on their objectives, financial situation, investment horizon, and particular needs. This report does not include information tailored to any particular investor. It has been prepared without any regard to the specific investment objectives, financial situation, or particular needs of any person who receives this report. Accordingly, the opinions discussed in this report may not be suitable for all investors. You should not consider any of the content in this report as legal, tax, or financial advice. The data and analysis contained herein are provided "as is" and without warranty of any kind. BentinPartner LLC, its employees, or any third party shall not have any liability for any loss sustained by anyone who has relied on the information contained in any publication published by BentinPartner LLC. The content and views expressed in this report represent the opinions of Marc Bentin and should not be construed as a guarantee of performance with respect to any referenced sector. We remind you that past performance is not necessarily indicative of future results. Although BentinPartner LLC believes the information and content included in this report have been obtained from sources considered reliable, no representation or warranty, express or implied, is provided in relation to the accuracy, completeness, or reliability of such information. This Report is also not intended to be a complete statement or summary of the industries, markets, or developments referred to in the Report.
Comments